


TLDR;
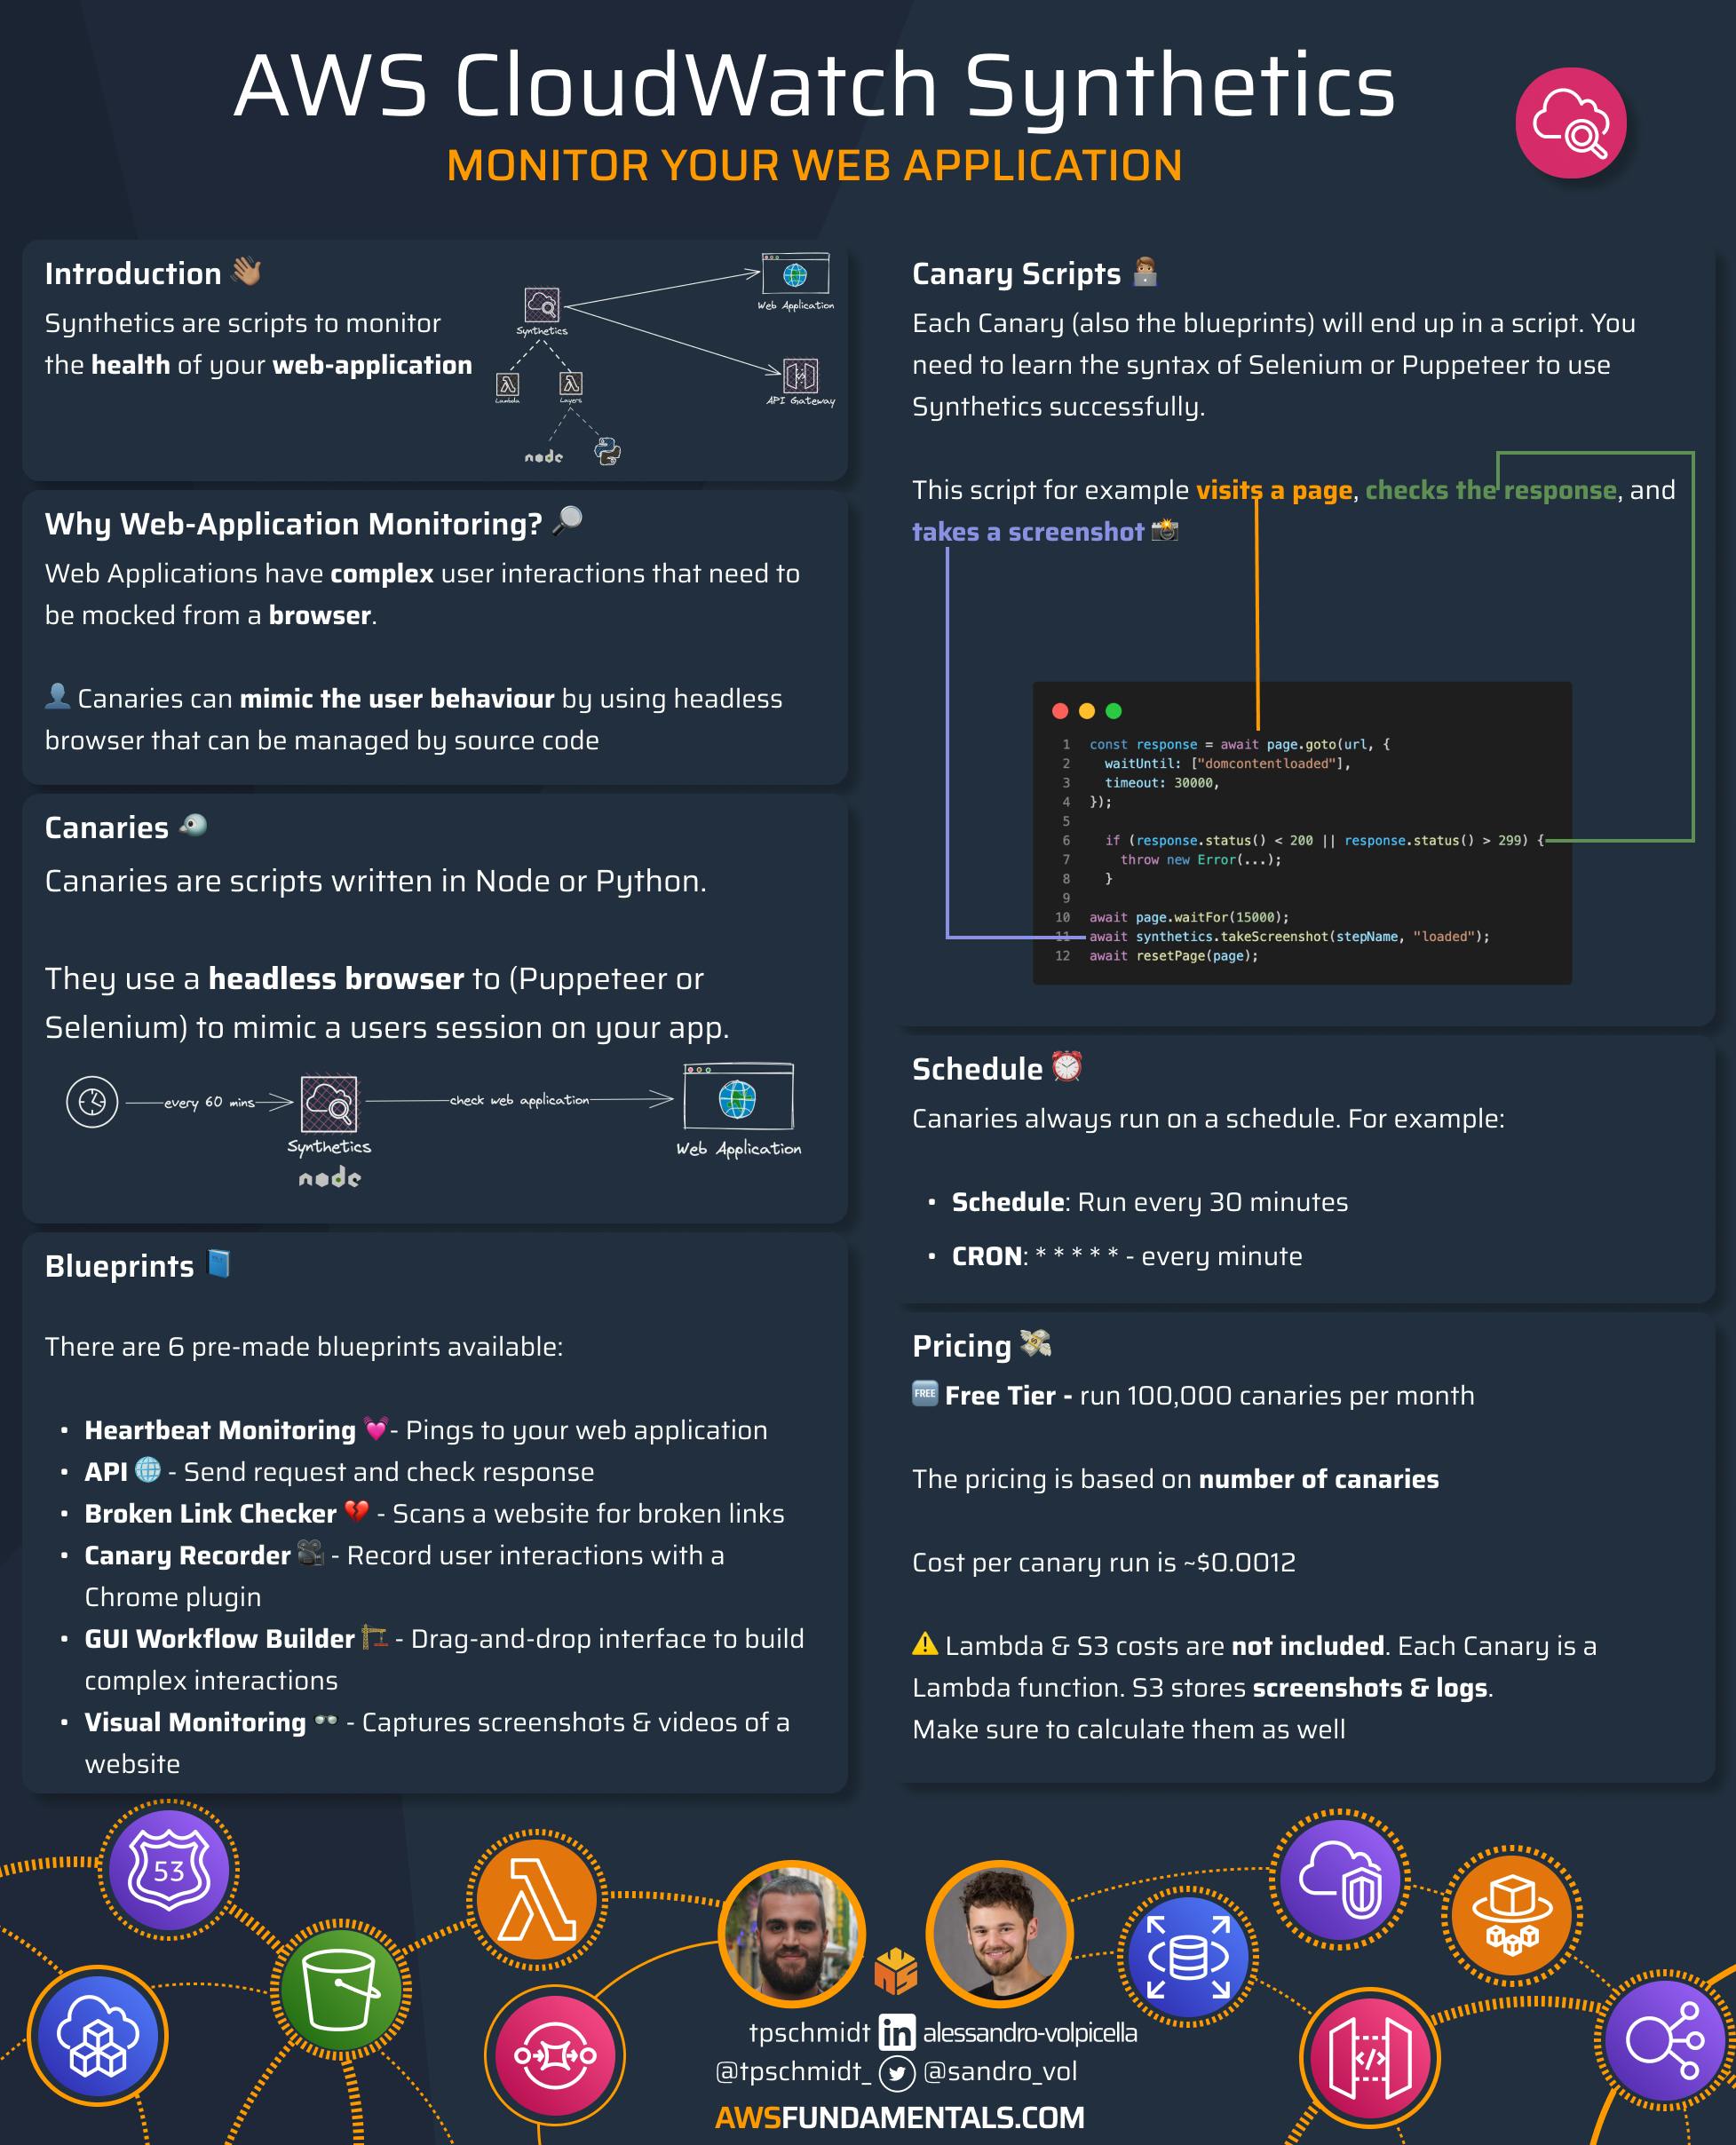
Here is a quick summary of this blog post in an infographic.
Introduction
Brief Overview of CloudWatch Synthetics
CloudWatch Synthetics is one of the lesser-known services in AWS. Synthetics allow you to create so-called Canaries. Canaries are written scripts that monitor your web application's health.
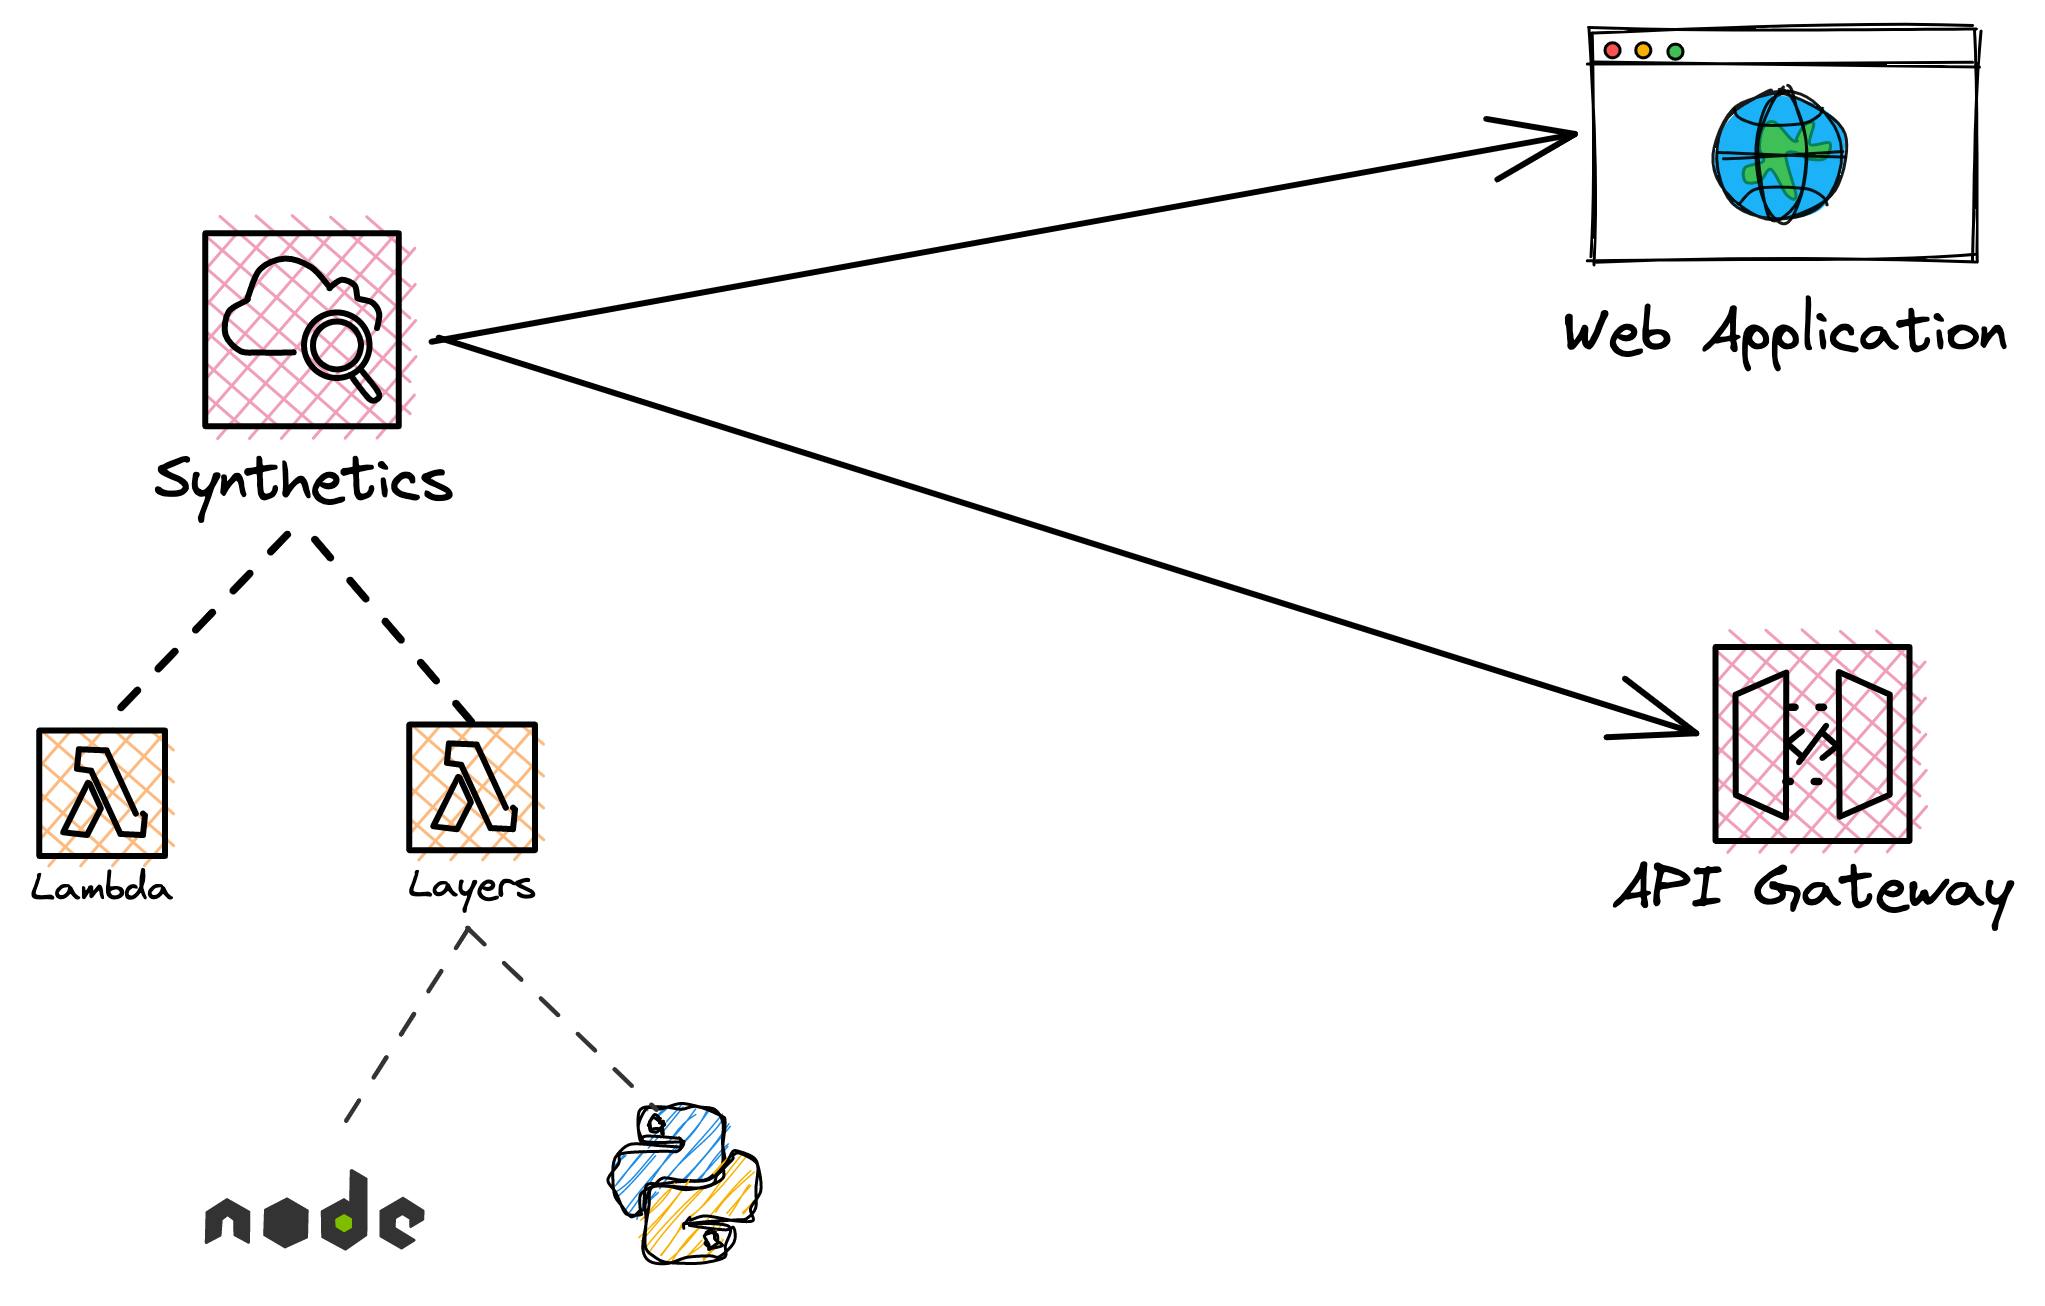
A Canary is a script written in Node.JS or Python. This script should mimic your user's behavior by interacting with your web application to see if everything is working. In the background, they use AWS Lambda to power the scripts.
This article will look into Synthetics and Canaries in more detail. We'll show you a step-by-step guide on how to create a Canary that regularly checks your web application.
Importance of Website & Application Monitoring
Why should you care about website monitoring anyway? For system monitoring, you already have CloudWatch Logs, Metrics, and Alarms. But for web applications monitoring is a bit different.
The typical flow of finding out that your website is having some errors is by customers telling you about it. That is precisely not what you want. What you actually want is an automated system that will tell you if something is going wrong.
CloudWatch Metrics & Alarms can help you with internal alerts already. For example, if your Lambda functions or your API is throwing lots of errors you can get notified by CloudWatch Alarms.
However, your main interest should be that your application works from a user perspective. The user is not using the Lambda function but the user is using your web application.
What is different with Web Applications?
The main difference in web applications compared to traditional alerting is how you collect your metrics and how you receive your errors. With Lambda functions it is fairly easy to understand when an error happens and when the Lambda runs successfully. But with your Web Application, you need to define the user flow and let the user know what to do. This requires additional work.
How Synthetics helps you with that
This is where Synthetics comes into play. Canaries in Synthetics act as your user by using a headless browser (e.g. Chrome that you can use in Code).
You can manage your browser via source code. For example, you can get HTML elements or visit websites:
WebElement textBox = driver.findElement(By.name("my-text"));
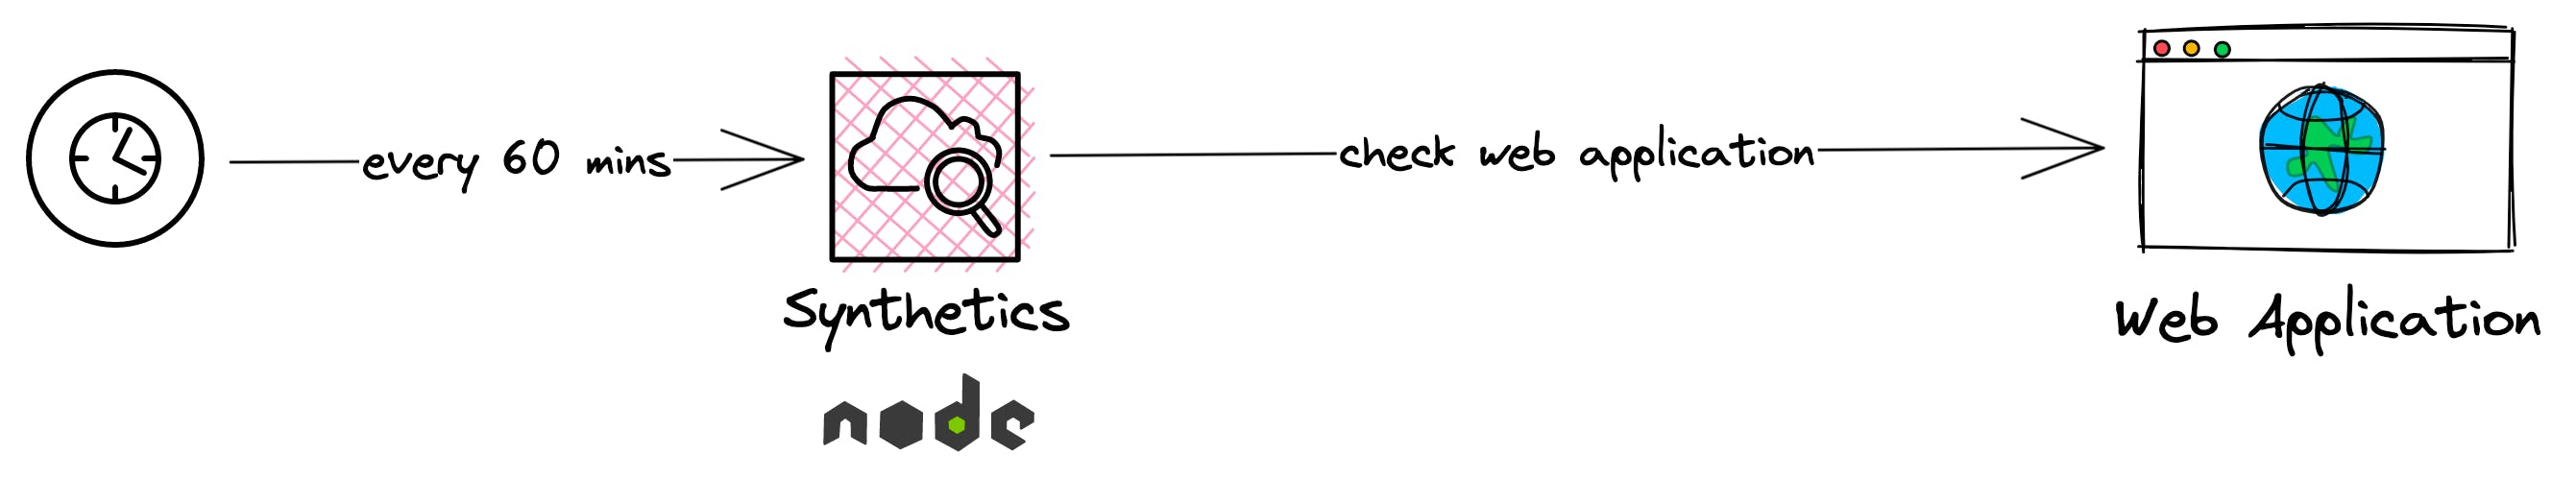
Your Canary script is executed on a regular schedule that interacts with your website. Canaries can act as your smoke tests and interact constantly with your web applications. If something fails you will get notified.
CloudWatch Synthetics Features
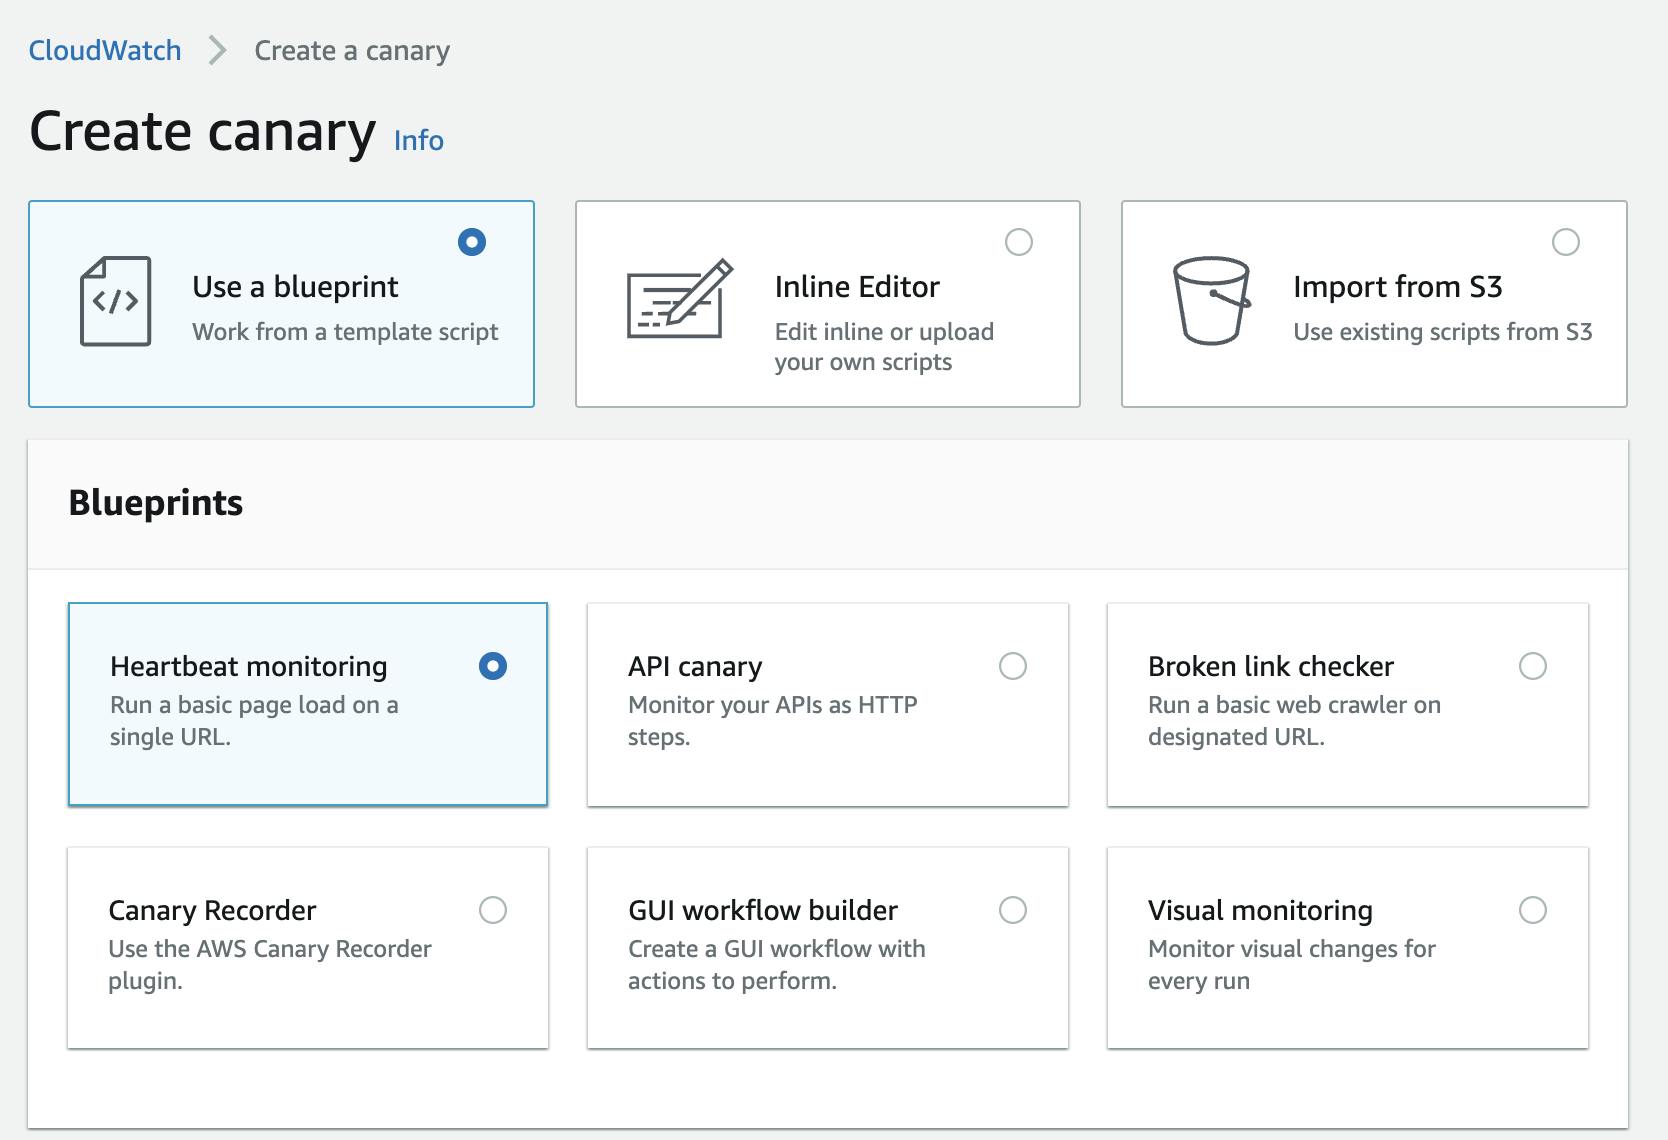
Let's first look over the main features Synthetics offers. You can create Canaries either via Blueprints or via a custom script. Blueprints are templates of your scripts. In the end, you will always have a Canary script. Blueprints just help you get started.
Blueprints
There are six different categories in which you can create a canary blueprint:
| Canary Blueprint Category | Description |
| Heartbeat Monitoring | A canary that sends a simple ping or request to a specified endpoint to confirm that it is up and running |
| API Canary | A canary that tests the functionality and performance of an API endpoint |
| Broken Link Checker | A canary that scans a website for broken links and pages |
| Canary Recorder | A canary that records user interactions with a website or application and replays them to identify issues |
| GUI Workflow Builder | A canary that uses a drag-and-drop interface to build complex workflows for testing |
| Visual Monitoring | A canary that captures screenshots or records videos of a website or application to identify visual issues |
We will create three different examples in these categories in this blog post.
Synthetics Chrome Recorder
A second way of creating your Canary scripts is by using the Chrome Addon CloudWatch Synthetics Recorder. This is an extension for Chrome that records your interactions on a certain website. These interactions will then be converted into a script that you can run inside a Canary.
This makes the first start of your initial script much easier. You will get an idea of how to handle the headless browsers Puppeteer or Selenium.
Inline Scripts
Canaries are always scripts that run your health check constantly. Whether you use the Chrome Recorder, Blueprint, or write your script custom doesn't matter. All these methods only help you get started.
If you are familiar with headless Browsers you can get started right away. We, however, recommend getting started with some blueprints to understand what the structure of the script typically looks like.
Runtimes
CloudWatch Synthetics supports two main runtimes:
Node.js with Pupeeteer
Python with Selenium
Both Pupeeteer and Selenium are headless browsers. A headless browser is a browser that you can interact with from the command line or with source code. With these functions, you can automate user interactions with a web application.
Check out the most recent versions here. The versions of the browsers are added to your Canary script via Lambda layers.
Use Cases - Let's create some Canaries
Okay enough with the theory. Let's create some canaries together. My goal is to check if our landing page and sign-up for our newsletter on AWS Fundamentals work correctly. So, let's create some canaries to check that.
Heartbeat Monitor Landing Page
Let's start with a basic ping first. I want to see if the landing page is still up.
Step 1 - Create a Heartbeat Blueprint
Go to CloudWatch Canary and click on Create Canary. Select Heartbeat monitoring.
Step 2 - Define a name and URL
Next, define the URL it should regularly check. I've added the URL of our landing page: https://awsfundamentals.com and gave the Canary the name ping-landing-page.
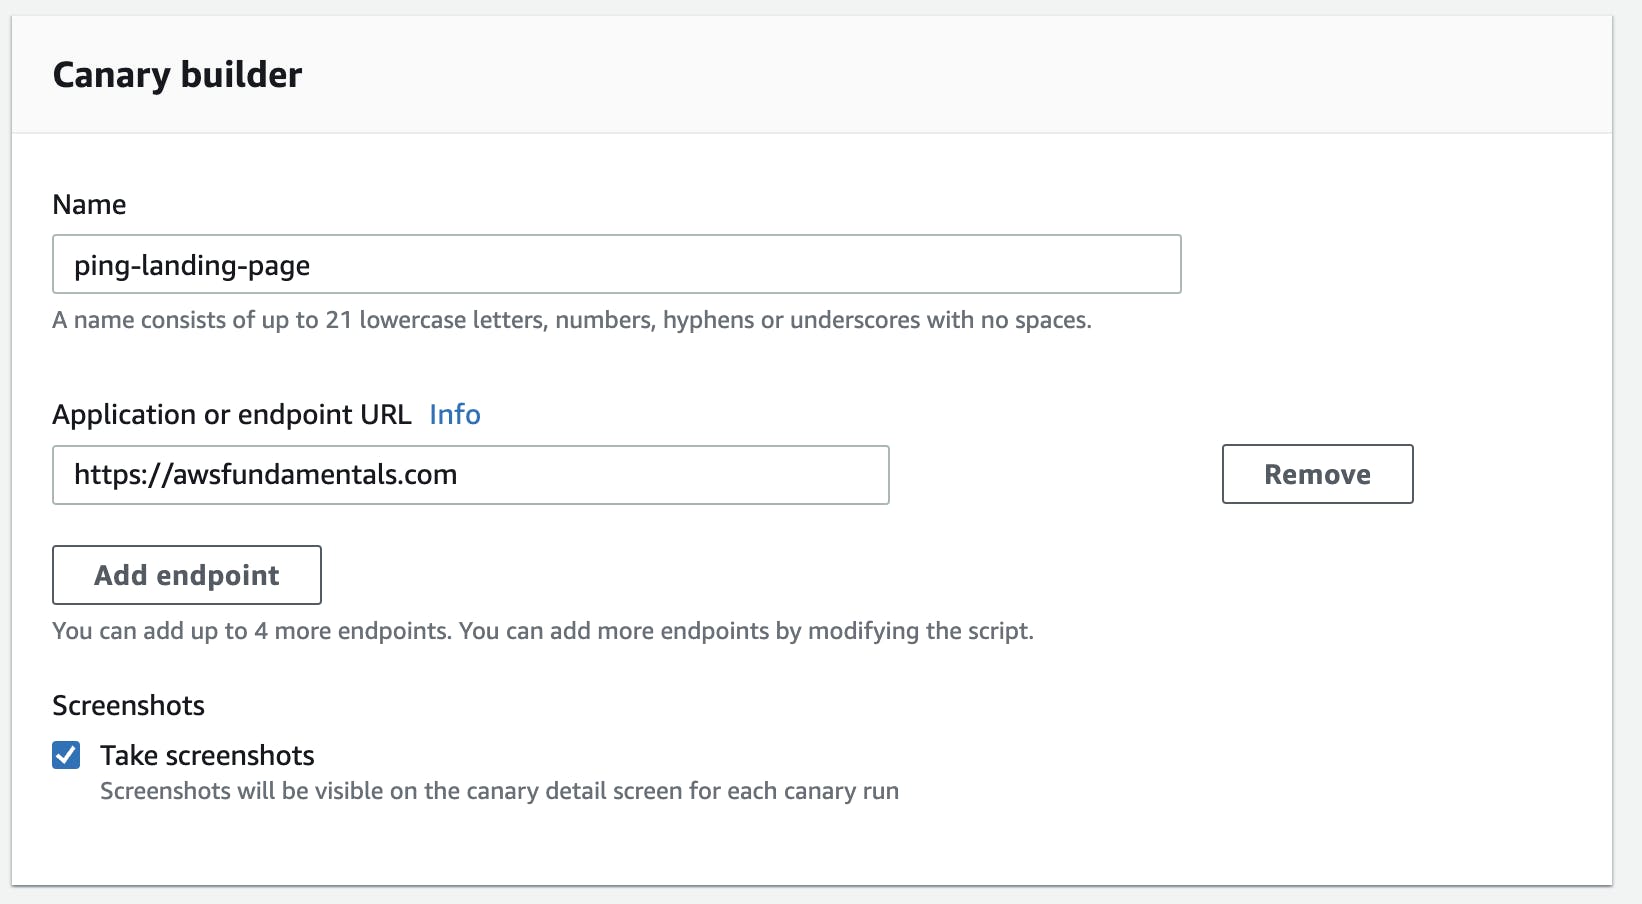
I also checked to Take Screenshots to see what happened.
Step 3 - Check Canary Script
What the blueprint is actually doing is creating a custom script for you. You can define to either use Node.JS or Python with the different runtime versions. I recommend you to use the latest version of either Python or Node. I am using Node in the following examples.
The script looks like that. I've shortened it a bit but you can see the whole script in your editor if you scroll down.
const { URL } = require('url');
const synthetics = require('Synthetics');
const log = require('SyntheticsLogger');
const syntheticsConfiguration = synthetics.getConfiguration();
const syntheticsLogHelper = require('SyntheticsLogHelper');

const loadBlueprint = async function () {

    const urls = ['https://awsfundamentals.com'];
    const takeScreenshot = true;
    syntheticsConfiguration.disableStepScreenshots();
    syntheticsConfiguration.setConfig({
       continueOnStepFailure: true,
       includeRequestHeaders: true, // Enable if headers should be displayed in HAR
       includeResponseHeaders: true, // Enable if headers should be displayed in HAR
       restrictedHeaders: [], // Value of these headers will be redacted from logs and reports
       restrictedUrlParameters: [] // Values of these url parameters will be redacted from logs and reports

    });

    let page = await synthetics.getPage();

    for (const url of urls) {
        await loadUrl(page, url, takeScreenshot);
    }
};
...
const loadUrl = async function (page, url, takeScreenshot) {
    let stepName = null;
    let domcontentloaded = false;
...
    stepName = new URL(url).hostname;
...
    await synthetics.executeStep(stepName, async function () {
        const sanitizedUrl = syntheticsLogHelper.getSanitizedUrl(url);

        const response = await page.goto(url, { waitUntil: ['domcontentloaded'], timeout: 30000});
        if (response) {
            domcontentloaded = true;
            const status = response.status();
            const statusText = response.statusText();

            logResponseString = `Response from url: ${sanitizedUrl}  Status: ${status}  Status Text: ${statusText}`;

            //If the response status code is not a 2xx success code
            if (response.status() < 200 || response.status() > 299) {
                throw new Error(`Failed to load url: ${sanitizedUrl} ${response.status()} ${response.statusText()}`);
            }
        } else {
            const logNoResponseString = `No response returned for url: ${sanitizedUrl}`;
            log.error(logNoResponseString);
            throw new Error(logNoResponseString);
        }
    });

    // Wait for 15 seconds to let page load fully before taking screenshot.
    if (domcontentloaded && takeScreenshot) {
        await page.waitFor(15000);
        await synthetics.takeScreenshot(stepName, 'loaded');
        await resetPage(page);
    }
};

const urls = [];

exports.handler = async () => {
    return await loadBlueprint();
};
What the script is doing is the following:
Set some default configurations
Load the URL
Wait until the document is loaded - if that doesn't happen within the 30s -> fail ❌
Check if the response code is between 200 and 299
Take screenshot
That's it.
Step 4 - Define the Schedule
I want to run this script on a schedule.
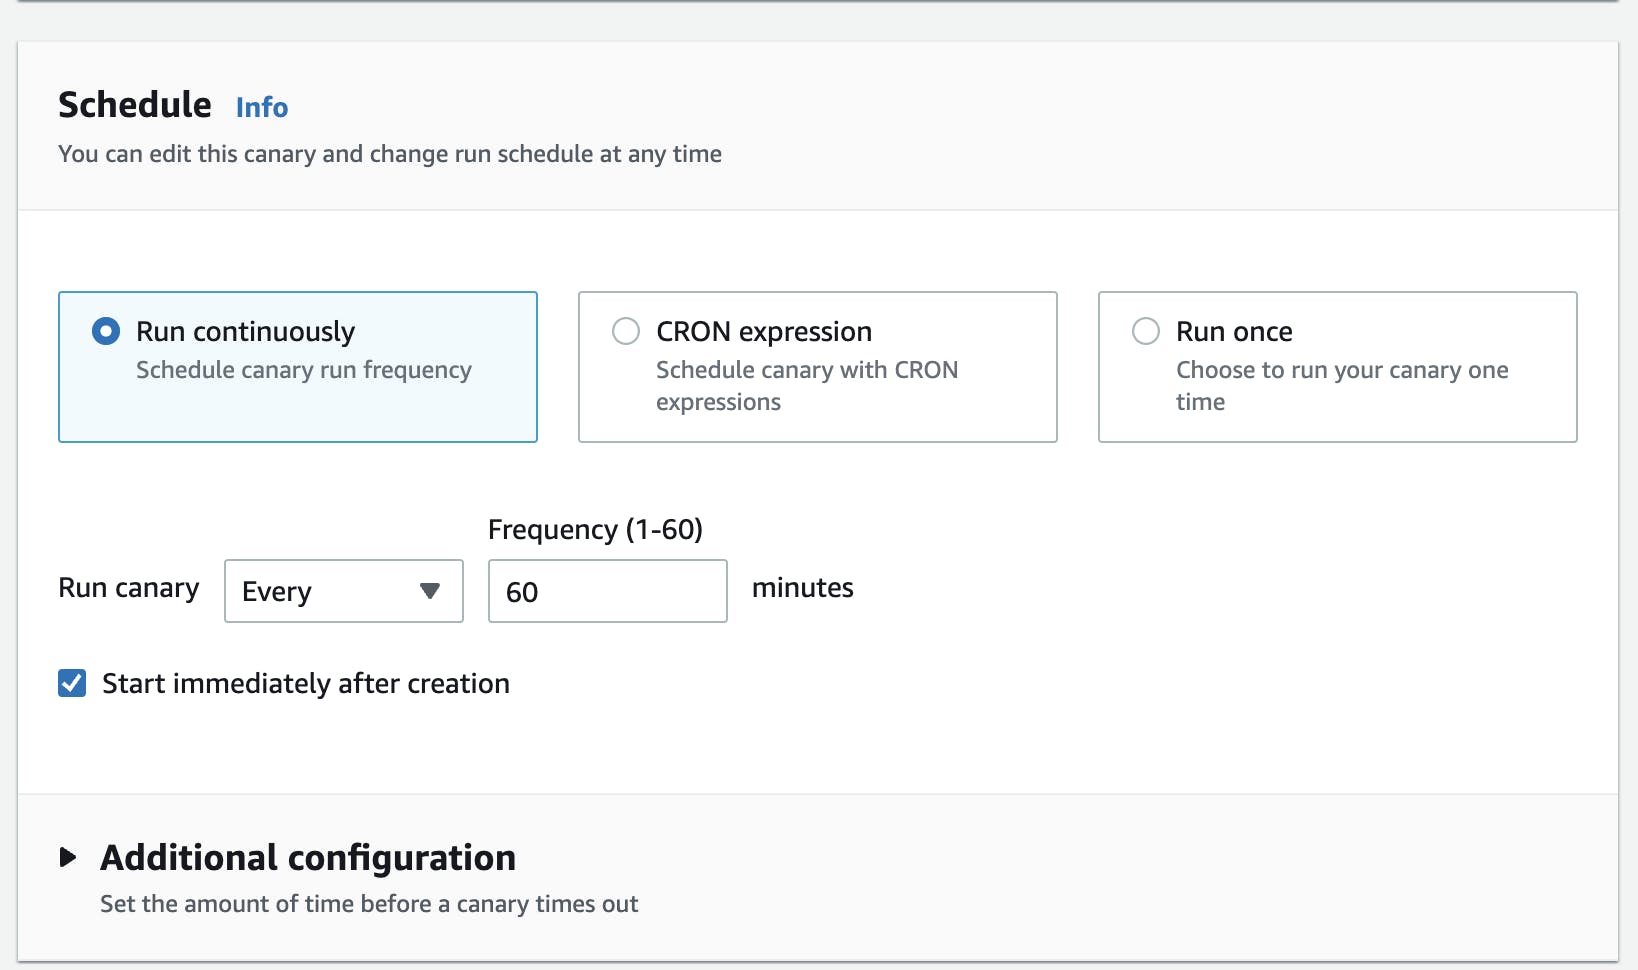
Let's define to let it run continuously every hour.
Step 5 - Create
There are many more options you can choose like
Data retention
IAM roles
Tags
Buckets to save the data
I leave everything with the default values and click on create. The canary will immediately launch.
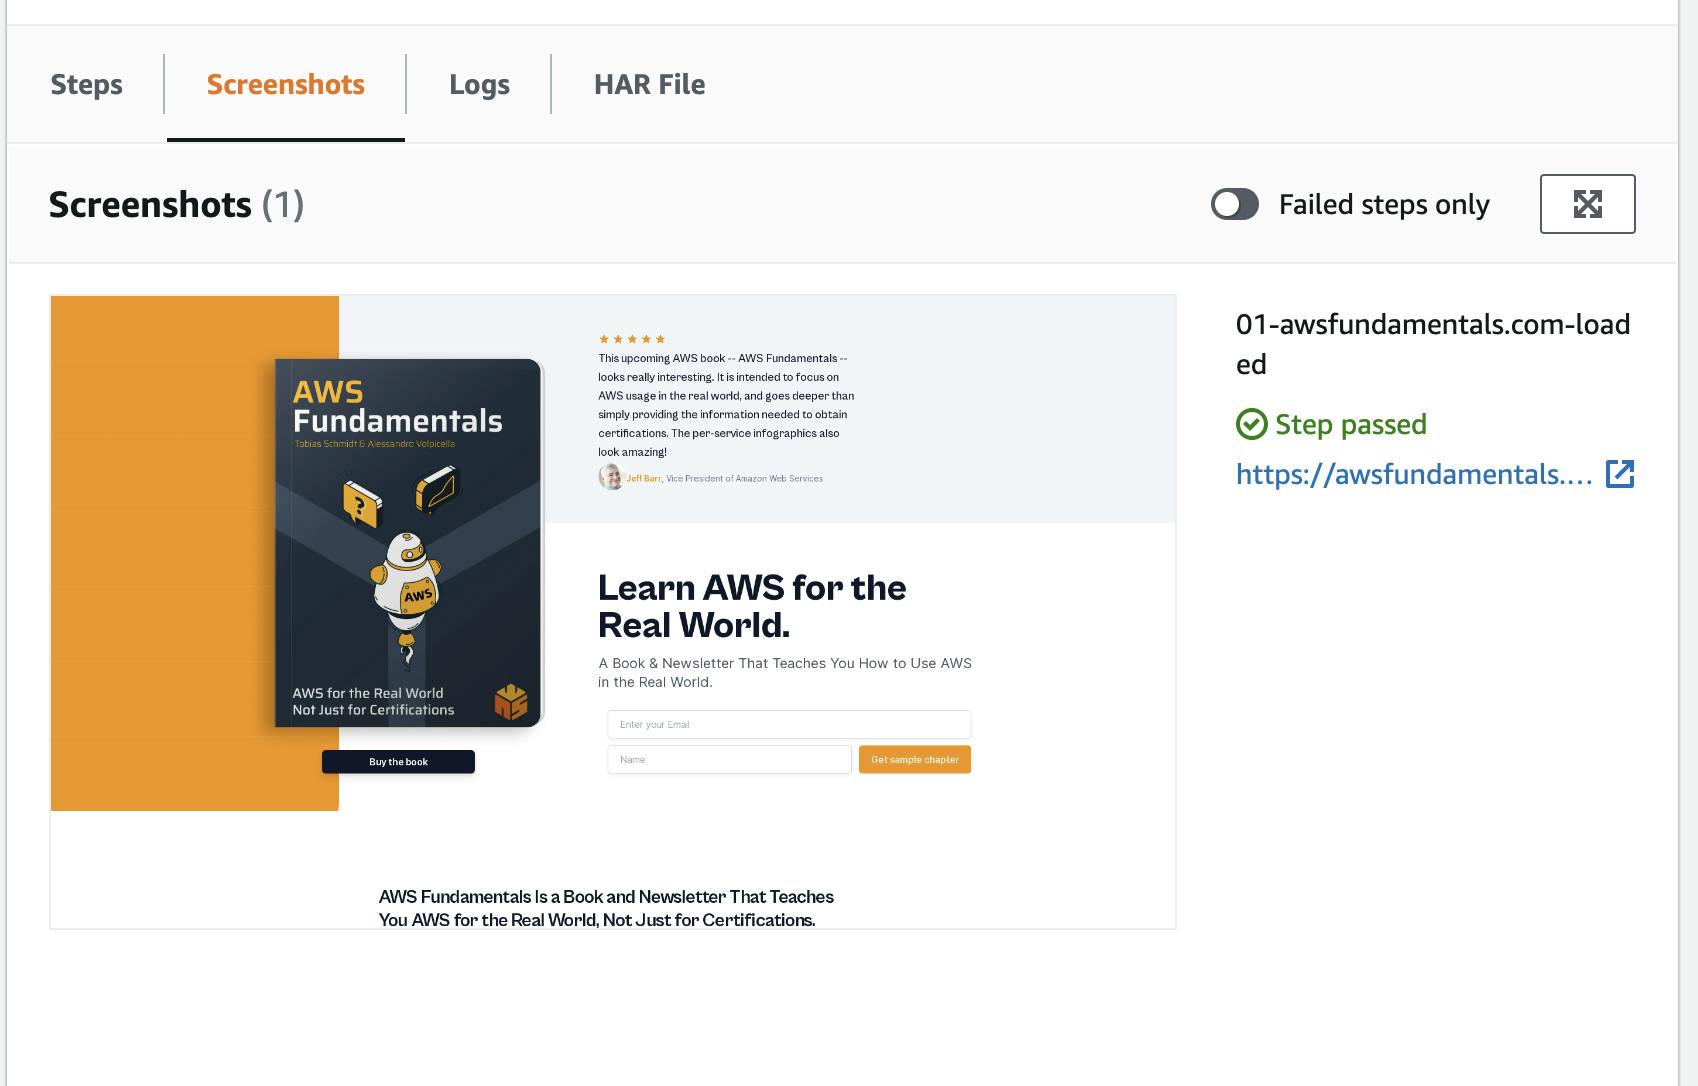
Results
The canary ran successfully. Let's check the screenshot that was taken.

For that scroll, a bit down, click on Screenshot, and Tadaa 🥳 there is your screenshot
Check API Endpoints
Next, let's check some custom APIs. Our landing page has its own Lambda Function URL for adding new subscribers to our e-mail list on Convertkit.
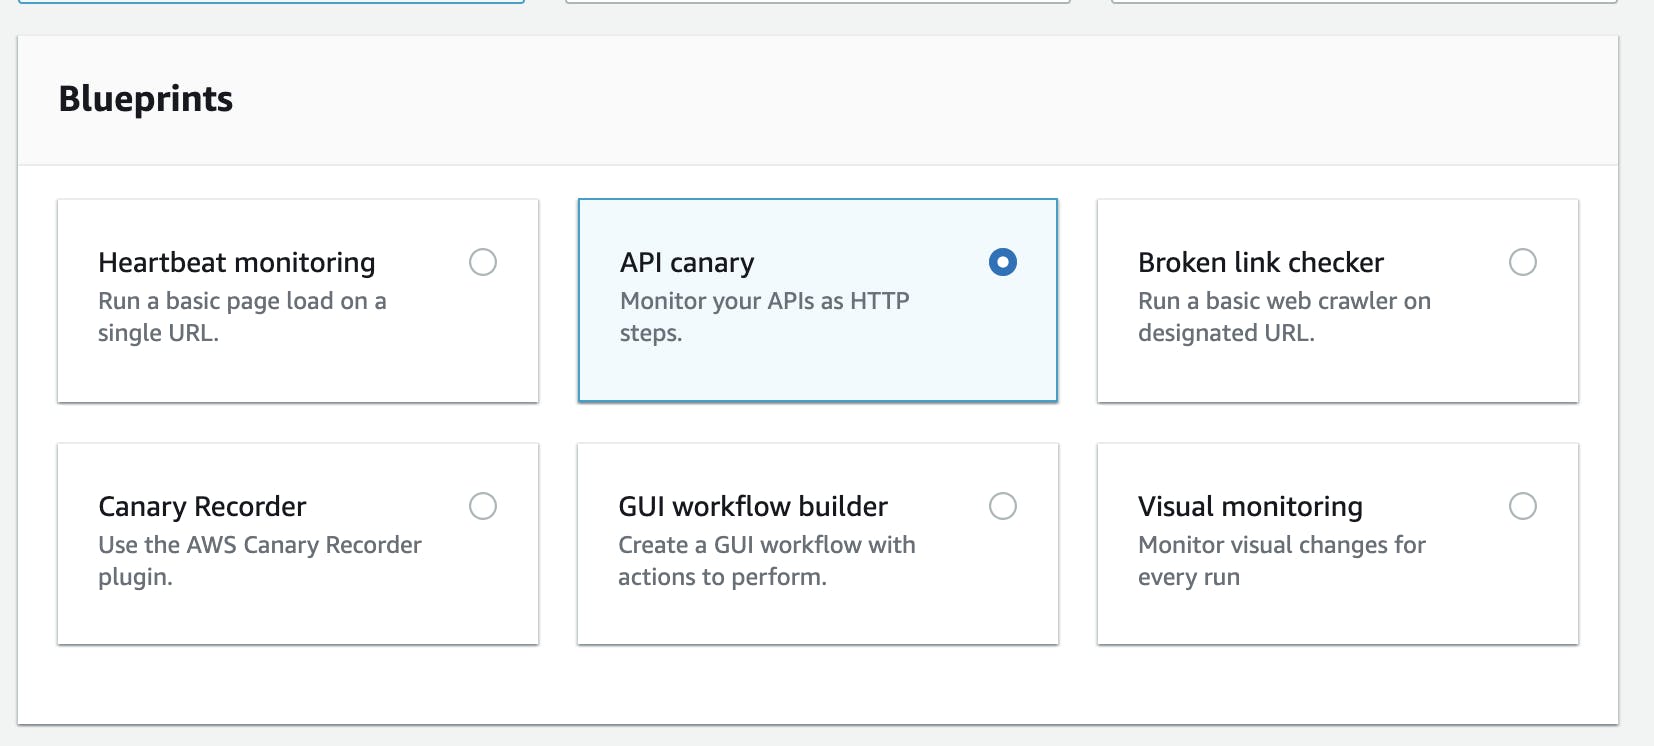
Step 1 - Create a new Blueprint API Canary
First, select the API Canary blueprint.
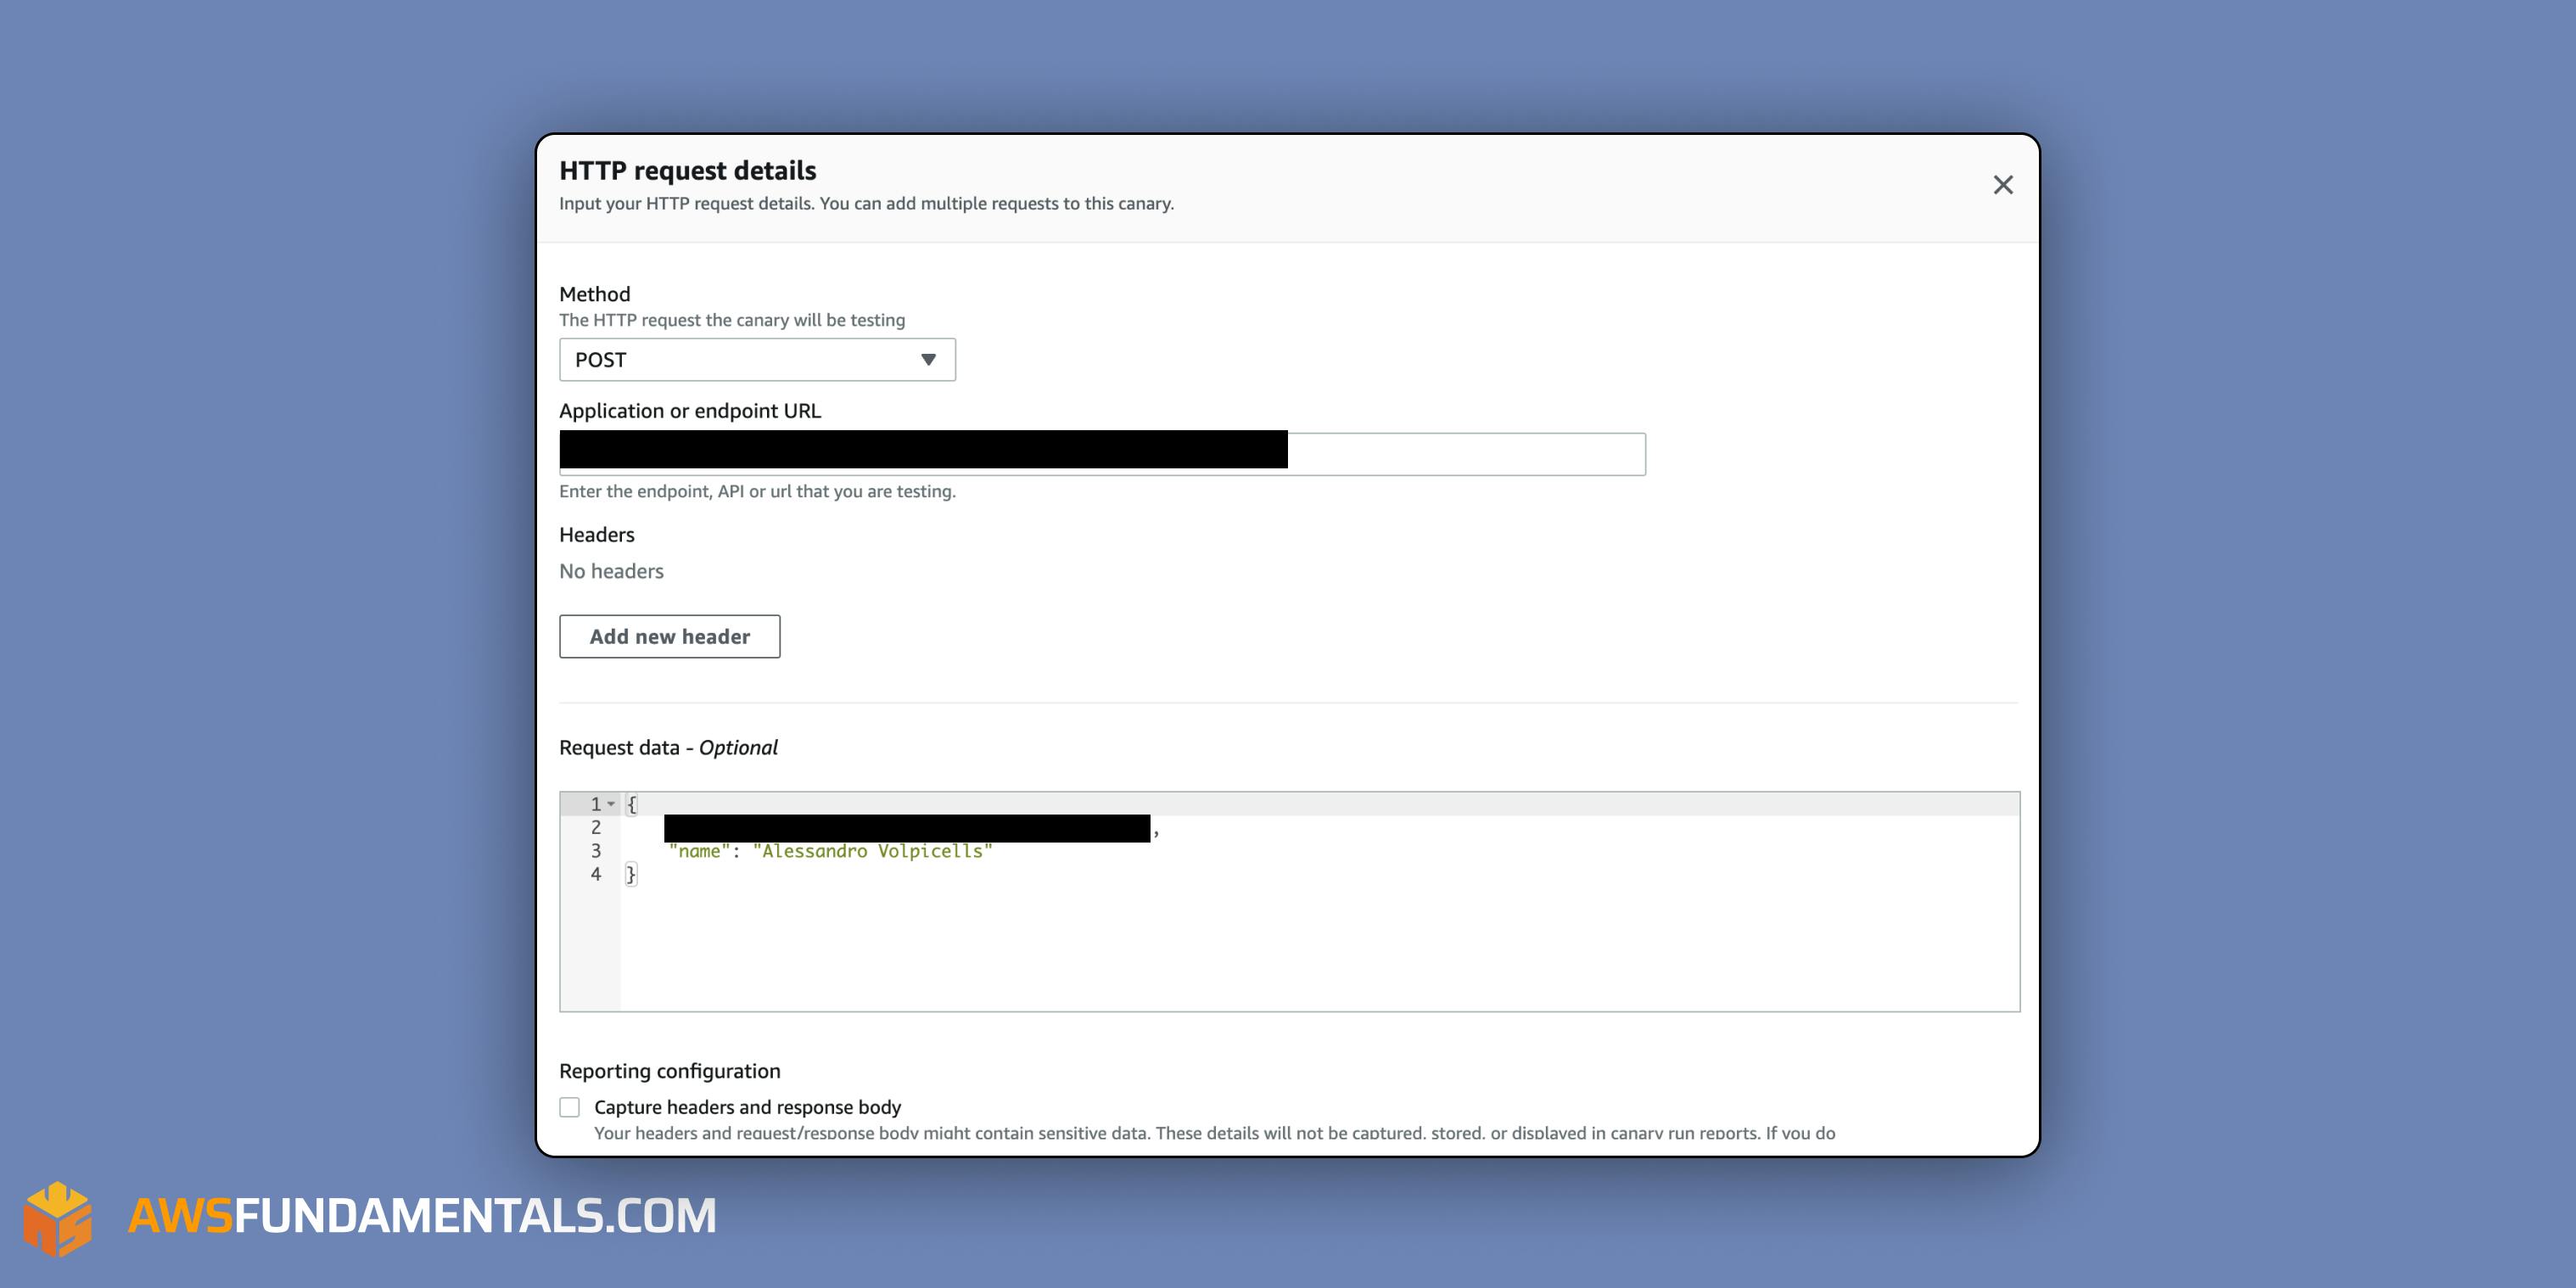
Step 2 - Add API endpoint
Second, add an API endpoint. I've redacted some data here. You can choose GET or POST as your HTTP method and add your body, headers, etc.
Step 3 - Check the script
Your Canary script is now created. Check your script and make sure it is doing what it should be doing.
const synthetics = require('Synthetics');
const log = require('SyntheticsLogger');
const syntheticsConfiguration = synthetics.getConfiguration();


const apiCanaryBlueprint = async function () {

    syntheticsConfiguration.setConfig({
        restrictedHeaders: [], // Value of these headers will be redacted from logs and reports
        restrictedUrlParameters: [] // Values of these url parameters will be redacted from logs and reports
    });

    // Handle validation for positive scenario
    const validateSuccessful = async function(res) {
        return new Promise((resolve, reject) => {
            if (res.statusCode < 200 || res.statusCode > 299) {
                throw new Error(res.statusCode + ' ' + res.statusMessage);
            }

            let responseBody = '';
            res.on('data', (d) => {
                responseBody += d;
            });

            res.on('end', () => {
                // Add validation on 'responseBody' here if required.
                resolve();
            });
        });
    };


    // Set request option for Add email to list
    let requestOptionsStep1 = {
        hostname: ...
        method: 'POST',
        path: '/',
        port: '443',
        protocol: 'https:',
        body: ...
        headers: {}
    };
    requestOptionsStep1['headers']['User-Agent'] = [synthetics.getCanaryUserAgentString(), requestOptionsStep1['headers']['User-Agent']].join(' ');

    // Set step config option for Add email to list
   let stepConfig1 = {
        includeRequestHeaders: false,
        includeResponseHeaders: false,
        includeRequestBody: false,
        includeResponseBody: false,
        continueOnHttpStepFailure: true
    };

    await synthetics.executeHttpStep('Add email to list', requestOptionsStep1, validateSuccessful, stepConfig1);


};

exports.handler = async () => {
    return await apiCanaryBlueprint();
};
Step 4 - Create a Canary
Click on Create and wait for your results 😊
Canary Chrome Recorder
The last canary we will create will use the Chrome extension for recording steps.
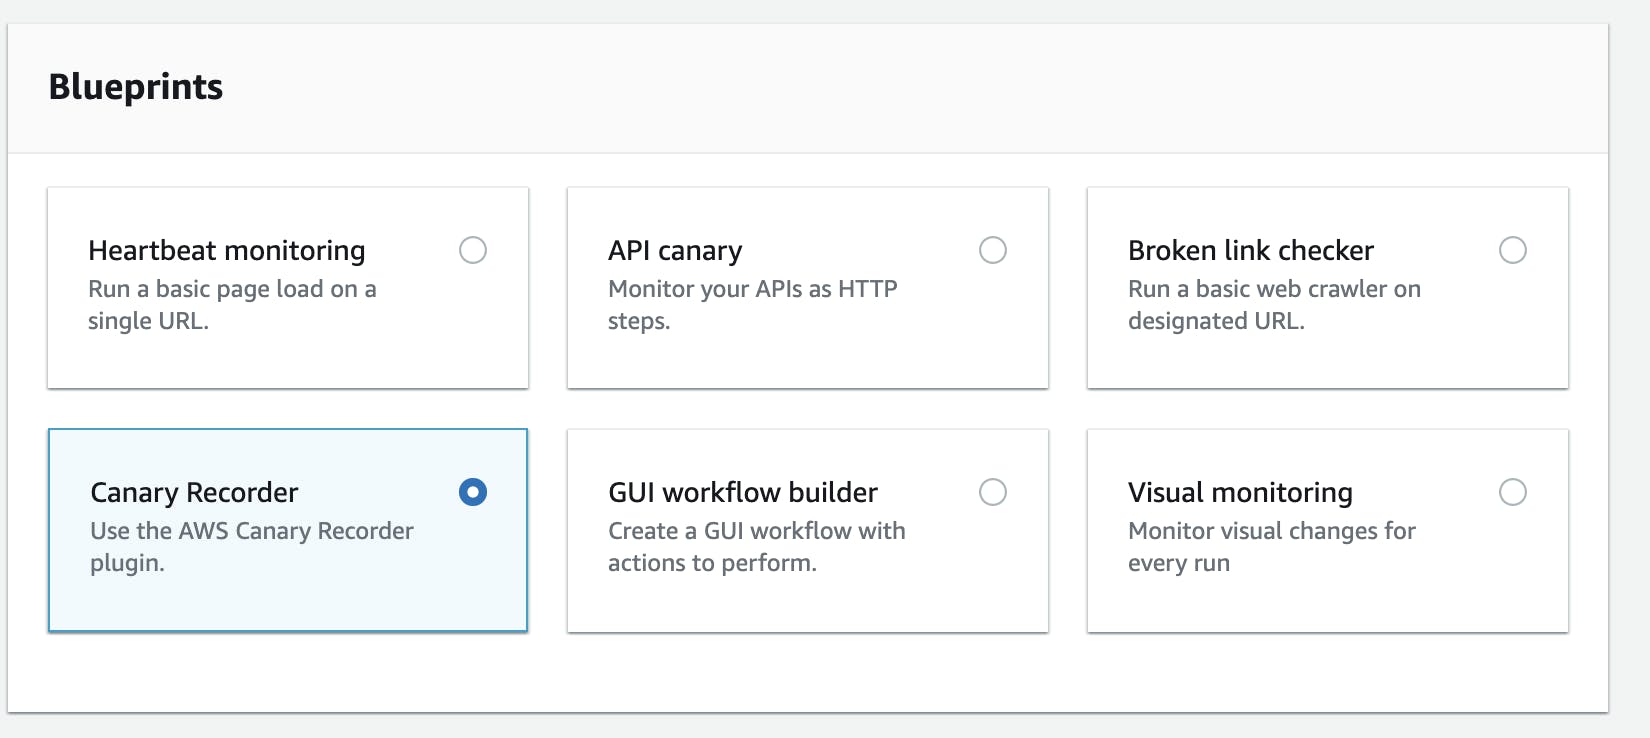
Step 1 - Choose Canary Recorder
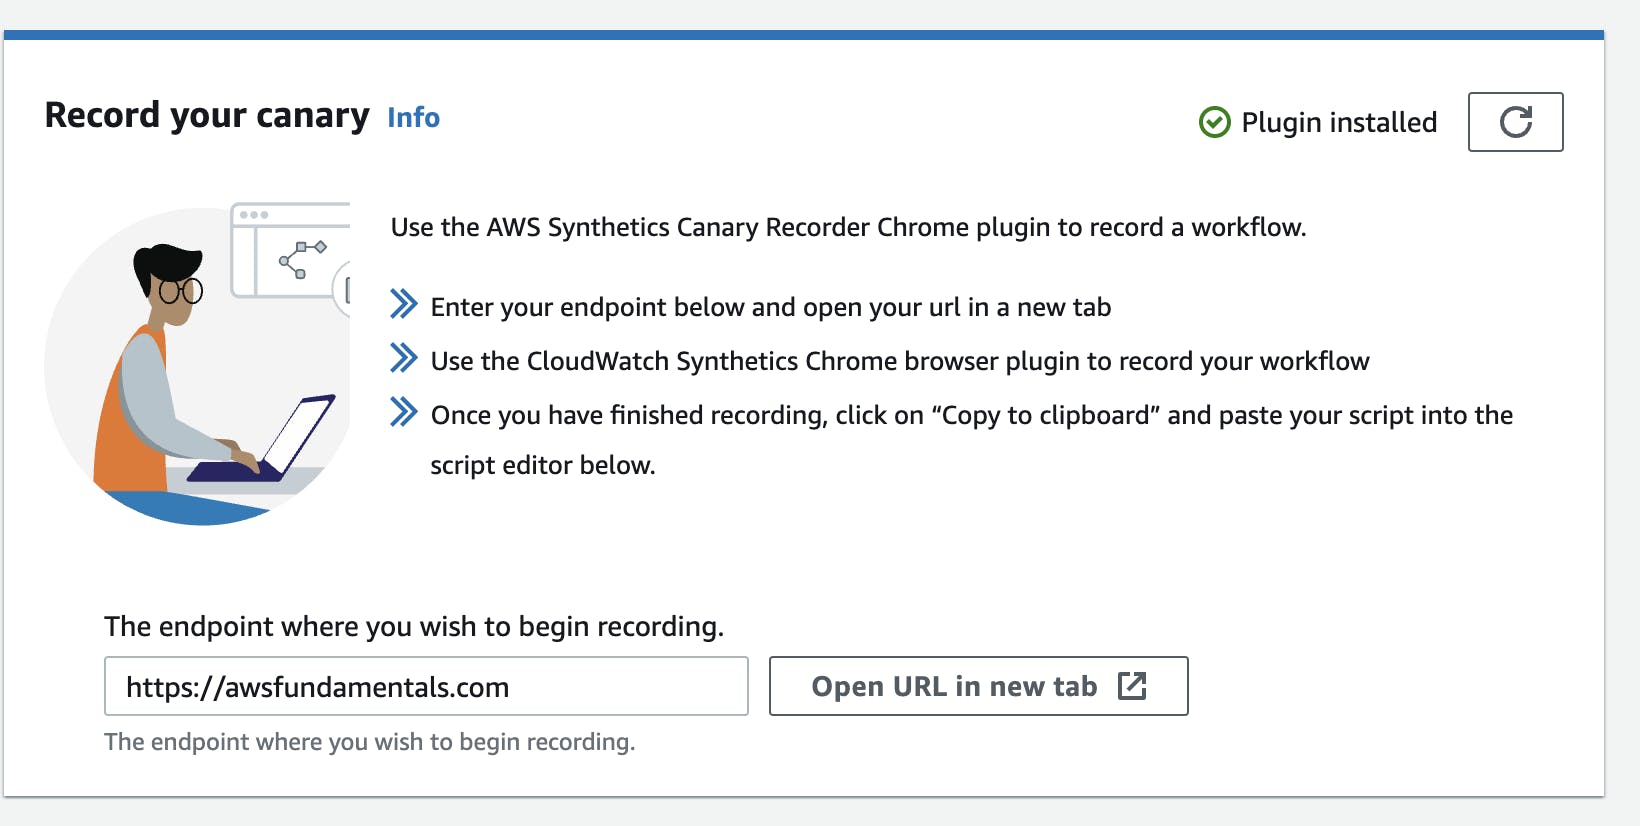
Step 2 - Enter an initial step and install the extension
Step 3 - Start Recording

Step 4 - Define the Schedule & Create
Define a schedule (e.g. every 60 minutes) and click on create. Your canary is now done
That's it!
We've created three different canaries now that can observe our application.
Pricing
CloudWatch Synthetics offers a free tier for the first 100,000 canary runs per month. Beyond that, there is a cost per canary run. The pricing is based on the number of canary runs per month and the duration of each run.
The cost per canary run is $0.0012 per canary run.
🚧 Costs for Lambda and S3 will not be included. Each Canary is running a Lambda function and storing things like logs & screenshots on S3.
Conclusion
With CloudWatch Synthetics you can monitor your web application. Especially more complex interactions, which are typical in web applications, can be handled very easily by using headless browsers. The canaries allow you to mimic the user's behavior.
The service offers a variety of blueprints for creating canaries, as well as a Chrome recorder for creating custom scripts directly from your interaction with the application.
Frequently Asked Questions (FAQ)
What are canaries in CloudWatch Synthetics?
Canaries are scripts written in Node.JS or Python that mimic a user's behavior to monitor a web application's health. They use AWS Lambda to power the scripts.
Why is web application monitoring important?
Web application monitoring is important because it allows you to proactively identify and fix issues before they impact your users. It also helps you ensure a positive user experience.
How does CloudWatch Synthetics help with web application monitoring?
CloudWatch Synthetics allows you to create canaries that act as your user by using a headless browser to interact with your web application. Canaries can act as your smoke tests and interact constantly with your web applications. If something fails you will get notified.
What are the main features of CloudWatch Synthetics?
CloudWatch Synthetics offers blueprints for creating canaries in six different categories, a Chrome recorder for creating canaries, and the ability to create custom scripts. It also supports two main runtimes: Node.js with Pupeeteer and Python with Selenium.
How much does CloudWatch Synthetics cost?
CloudWatch Synthetics offers a free tier for the first 100,000 canary runs per month. Beyond that, there is a cost per canary run based on the number of canary runs per month The cost per canary run is $0.0012. Don't forget to add Lambda and S3 costs
Related Reads
If you found this article on using CloudWatch Synthetics to monitor your web application helpful, you might also be interested in these: